
I wrote an article about Leapfrog integration in Finnish last week. For the article I used Colab Python, the graphs were made with matplotlib-library. I decided to play with the code using GeoGebraPython from https://geogebra.org/python. I wanted to learn how to animate the objects in my code.
The idea for the Python code is to compare two simulation methods with the theoretical values. The first is using formulas of constant acceleration during the time step dt. In the code below the acceleration is calculated from harmonic force equation ma = -kx. In row 41 the constant H = -k/m.

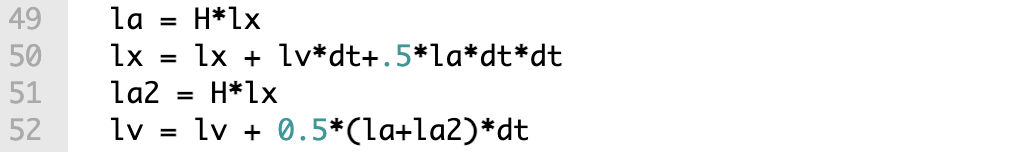
The second method is Leapfrog integration, where the acceleration is calculated also at the new x-value, the velocity is calculated using average acceleration.
The animation is created using GeoGebra’s Point command. In row 45 the first variable 0 is x coordinate, second variable x is y-coordinate and the rest are properties for the point named paikka. The teorpaikka is calculated value for the theoretical value and lpaikka is the value from leapfrog integration.


The teorpaikka is calculated with equation
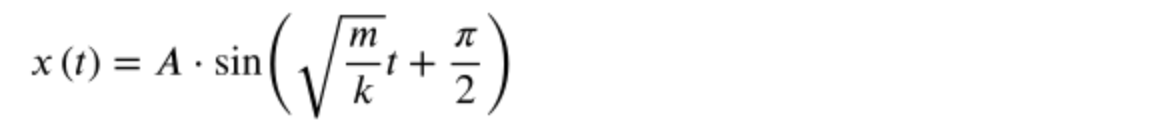
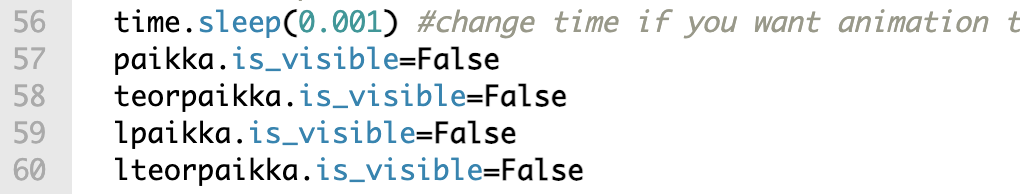
Later in code we change the visibility of the points.

Link to the GeoGebra/Python code.
references
My original article in Finnish
https://mikkorahikka.blog/2023/08/21/varahtelevan-jousen-liikkeen-simulointi-pythonilla-leapfrog-integrointi/
Original Python code in Colab
https://colab.research.google.com/drive/1JIcqE5mECFpF3naFlH2CVHwfXQfs9blp?usp=sharing
Leapfrog integration in Wikipedia
https://en.wikipedia.org/wiki/Leapfrog_integration
Peter Young’s article ”The leapfrog method and other “symplectic” algorithms for integrating Newton’s laws of motion”
https://young.physics.ucsc.edu/115/leapfrog.pdf
Rhett Allain in Wired. “The Leapfrog Numerical Method”
https://www.wired.com/2011/02/the-leapfrog-numerical-method/

Jätä kommentti